Callahan's CUPP Scoring System
Jump to section to learn more:
What is CUPP?
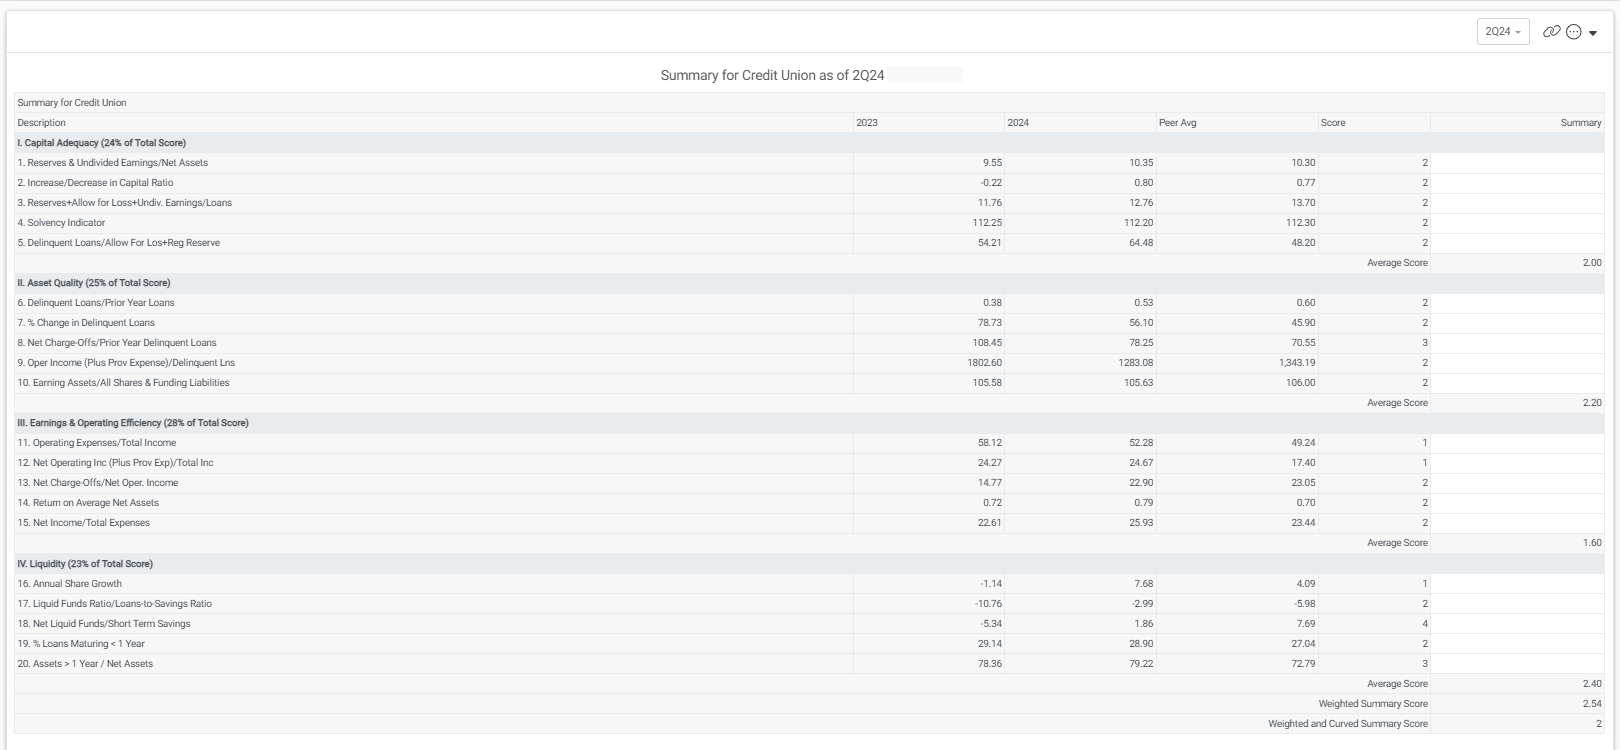
The Credit Union Performance Profile (CUPP) is a scoring system developed by Callahan to provide a data-driven assessment of key financial areas, including asset quality, capital adequacy, earnings & operating efficiency, and liquidity, offering insights into a credit union’s financial health and operational stability. Scores run from 1 to 5, with 1 being the best.
Designed as an alternative to the NCUA's CAMELS rating system, which has been in place since 1978, CUPP takes a streamlined approach. While CAMELS includes qualitative components such as “Management” and “Sensitivity to Market Risk” (introduced in 2022), CUPP focuses solely on metrics derived from 5300 Call Report data, ensuring an entirely data-driven evaluation process.
Peer Pointer!
Like CAMELS, Callahan's CUPP Scoring can be an effective tool for preparing for NCUA examinations and assessing the overall financial health of your credit union
Understanding CUPP Scoring
CUPP evaluates a credit union’s performance based on 20 ratios—five in each of the four categories CUPP covers.
- Capital Adequacy
- Asset Quality
- Earnings
- Liquidity
Each of the four subcategory sections of CUPP provide an "average" score for the section, which is a straightforward average calculation. These subcategory scores are not a direct part of the overall score, though they do correlate. Instead, they are meant to help you understand your relative performance in that particular section. These deep dives into a specific section are the ultimate goal of Callahan's CUPP designed to help you isolate any potential areas of concern in advance of a regulator visit, and dive into the details.
To calculate the Weighted Summary Score viewable on CUPP's Summary scorecard display, we take the sum of the scores in each section, and multiply by the weighting for the section. Add all of these weighted totals together, then divide by 4 to get the Weighted Summary Score.
To get the final Weighted and Curved Summary Score, Peer is calculating a Weighted Summary Score for every credit union in your peer group at once, all done "behind the scenes". All of those Weighted Summary Scores are then sorted into a leader table. Peer also calculates the Percentile Ranking for your primary on those leader tables.
The curved scores are given based on that percentile as follows (similar to the NCUA's style for CAMELS, it is not a uniform distribution).
Score Percentile Ranking Interpretation
1 = Top 25% Excellent Performance
2 = 25% to 75% Performing Above Average
3 = 6% to 25% Average Performance
4 = 1% to 6% Requires Further Analysis
5 = Below 1% Requires Special Attention
Peer Pointer!
It is important to note that the term "average" as used above does not comply with our usual mathematical understanding of the word. The regulatory use can be interpreted as meaning that those credit unions scoring 3 and above are operating safely and do not require any special intervention. Those scoring 4 require corrective measures and those scoring 5 are more likely to be subjected to supervisory remedies such as merger, liquidation, etc.
Using CUPP in Peer Suite
You can access CUPP displays in the CU Performance Reports folder within Peer Suite’s left navigation.

Please note that CUPP displays are available only at the Premium and Plus levels of Peer Suite. If you’re interested in learning more, please reach out to your account manager.

