How to Use ROM (Classic Peer)
How to Use ROM:
Before you jump into using ROM in Peer-to-Peer, you need to set up your analysis properly in order to make your analysis meaningful.
We’ve got you covered!
Get Started: Setting Up Your Analysis
To properly use the ROM scoring system, the first step is to make sure you have your analysis properly set up with an individual institution as your primary, and an asset-based peer group as your comparison set.
Asset-based peer groups are already built-in and ready for you to use. While you may use a custom peer group, we recommend getting started with one of our pre-built groups.
ROM generates scores based on benchmarks, and therefore, will not work if you do not have a peer group in your comparison set.
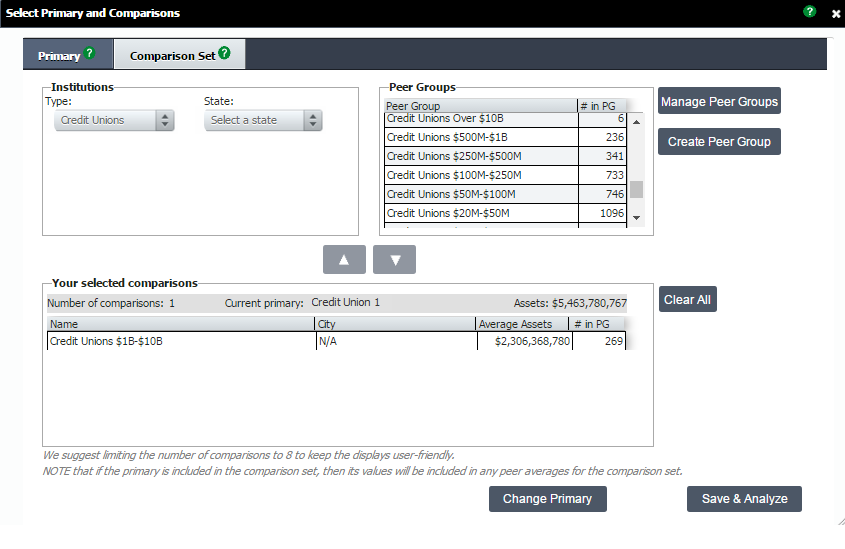
Read or Watch Our Guide to Setting Up Your Primary and Comparison Set
There are two built-in ROM report ready and waiting for you in Peer-to-Peer.
If you navigate to Scoring & Benchmarking on the left hand navigation, and click on Return of the Member Index, you will see two analyses.
ROM Detailed Report: Your Primary
Return of the Member Scoring Display
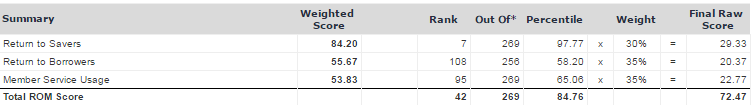
On the Return of the Member Scoring display, you can see the overall percentile ranking of your primary institution compared to the comparison set, then a breakdown of each component of the three areas of ROM:
- Return to savers
- Return to borrowers
- Member service usage
This display gives you your primary’s value, the peer average, and the rank.
It also shows your percentile ranking for each component and the weighting.
Looking at this display will give you an idea on how your credit union is performing compared to peers as well as your strengths and areas for improvement.
View Detailed Report in Peer-to-Peer
ROM Component Details:
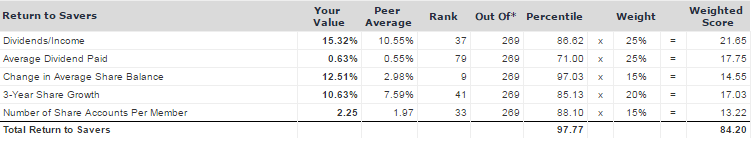
The first component of the Return of the Member scoring system is Return to Savers.
It measures how well a credit union is providing deposit services to its members.
In addition to measuring dividends to income, this component also takes into account average dividend paid, growth in average share balance, three-year share growth of the credit union and the number of share accounts per member.
Return to Borrowers
The lending component Return to Borrowers, recognizes that credit unions were created to provide credit to their members at a reasonable cost.
The index rewards those credit unions that offer a lower rate on loans, but it also considers the historical growth in lending and the variety of products offered to its members. .
In recent years, credit unions have started to sell more loans to the secondary market. To accommodate credit unions becoming more involved in the secondary market, Callahan & Associates has added the loan servicing portfolio as a component of the score.
Return to borrowers also looks at:
- Yield on average loans
- Loans per member
- 3-year loan growth
- Year-to-date loan originations per member
- Change in average consumer and real estate loan balance
Member Service Usage
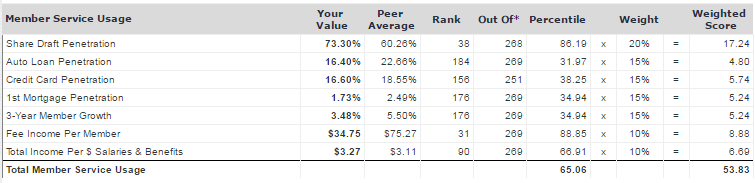
The final component is Member Service Usage. This component measures how efficiently a credit union provides and promotes services to its members.
The leaders in this category are those credit unions that have a high number of core account relationships with their members.
The penetration rates are a key metric as to how members value the credit union’s product offerings. Do members consider the credit union their primary financial institution (PFI) or are they looking elsewhere for their other financial needs? Moreover, measuring productivity of employees by calculating the amount of revenue generated per dollar of salary and benefit expense helps to capture the staff involvement in member activity.
There is a positive correlation between member activity and the amount of income generated per employee as credit unions with a more active membership base are more likely to use the credit union as their PFI and generate more revenue. Attractive rates and products attract new members.
ROM Leader Table
Display ROM Scores for Each Credit Union
If you wanted to see your score in relation to peer performance, you can go to the ROM Leader Table.
This display lists your primary and every institution within your comparison based on ROM scores.
As you scroll through you will see your primary highlighted in blue. By default this is ranked based on Total ROM score, but you can re-rank based on which metric you are most interested in by clicking on the column header.
For example, if you are interested in seeing leaders in member service usage, you can sort the table by that subcategory. You now know which credit unions are performing well and can analyze them further within Peer to Peer to see how they received such a high score.
View Leader Table in Peer-to-Peer
