Data Connector Guide
The Peer Suite Data Connector serves as an extension of Peer Suite, offering a way to refresh and manipulate Peer Suite data directly within Excel. Using this tool significantly reduces the need for repetitive quarterly reporting export tasks.
This guide will walk you through the core functionalities of the Data Connector.
*Please note this tool is not compatible with Mac computers.
The Peer Suite Data Connector is available only to credit unions with Premium or Plus level Peer Suite subscriptions. Think your team could benefit from this tools? Schedule a conversation with your account manager.
Jump to a section to begin exploring this tool!
Key Functions
- Export Tables of Refreshable Data:
- Export display's from Peer Suite to Excel, which can be refreshed to incorporate the most up-to-date information.
- Modify Data in Your Excel Workbook:
- Customize your Excel workbook to include different account codes/metrics, quarters, peer groups, or institutions.
How To Export Displays Using the Data Connector:
- Open your desired display, folder, or dashboard in Peer Suite.
- From the "Download" dropdown (located in the upper right corner of your canvas) select the "Data Connector" option.

Upon opening your freshly downloaded workbook, you'll find basic instructions for using the tool and tabs for your downloaded displays at the bottom of your screen.
If you encounter any issues accessing your workbook, follow these steps:
- If there are any of these prompts: “Enable Editing,” “Enable Content,” or “Enable Macros,” Click Yes/Enable.

- If you don’t see these prompts choose File, select Options, go to Trust Center, and then access Trust Center Settings, From the Macro Settings page choose “Disable all macros with notification.” Then close the worksheet and reopen it.

- If you are not prompted to log in after completing the above steps, open the document’s properties and ensure the “Unblock” option is checked at the bottom of the “General” tab. After you check the “Unblock” box, click Apply. Reopen the document to apply changes and log in using your Peer Suite credentials.


- You will be prompted to log in after you click on the tab for your downloaded display(s).
- Log in with your Callahan credentials (the same credentials used to log into the Callahan Portal).
- This creates the link between Peer Suite data and your downloaded workbook.

Peer Pointer!
If you would like to share your findings with other users in your organization who prefer not to log in or do not have login credentials, they can view the data without VBA capabilities by clicking “Use Offline," when prompted to log in.
How to Use the Data Connector
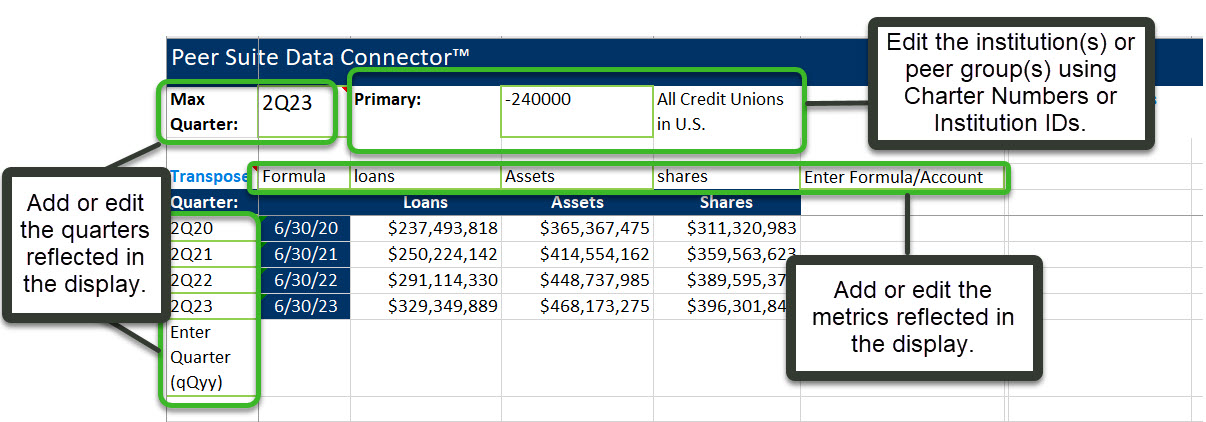
Once you've exported the data using the Data Connector, you can modify the contents of any cell outlined in bright green.
Depending on the table you’re working with, you can change:
- Quarter(s)/Timeframe
- Change or Add Account Codes/Formulas
- Update Your Comparison Set (the institutions and peer groups for which you're viewing data)
Quarters/Timeframe
For single-quarter tables, change the displayed quarter by clicking in the green-outlined "Quarter" cell. For historical tables, alter the latest quarter by clicking in the green-outlined "Max Quarter" cell.
Change or Add Account Codes/Formulas
Similar to custom Peer Suite displays, you can use three types of inputs to add or change data points in your Excel table:
- 5300 Report Account Codes:
- Add a new 5300 account code to the spreadsheet by typing in the green-outlined cell.
- For example: “a024” will populate Unsecured Credit Card Loans in the table.
- To find account codes, refer to the NCUA 5300 Report, the NCUA 5300 Report Definitions, or the NCUA Credit Union Profile.
- Add a new 5300 account code to the spreadsheet by typing in the green-outlined cell.
- Smart Codes, also referred to as ‘Defined Facts:’
- Many commonly-used formulas and 5300 account codes are saved in user-friendly shorthand maintained by Callahan’s analysts, called "Smart Codes."
- For example, you can enter: ‘ROA’, ‘assets’, ‘loans’, and many others directly into the Data Connector. See the full list here: Callahan’s Smart Code Dictionary.
- Formulas: Combinations of these items can be input as formulas using functions and operators.
- For example: “(a958+a968)” for auto loans or “(a958+a968)/(members)*100)” for Auto Loans/Members.
- Learn more about building formulas: HERE.
Update Your Comparison Set
- Add an institution: by inputting either the institution’s Charter Number or Institution ID (the Institution ID needs to be formatted as a negative number for Data Connector input) in the appropriate green-outlined cell.
- Add a Peer Group: by adding it’s Institution ID (-CDSID)
Jump to this section to see how you can look up a charter number or Institution ID: Find a Charter Number/Institution ID(-CDSID)
Additional Data Connector Functionality
Transpose Rows/Columns
- Transpose the table axes by double-clicking transpose at the top of your table to left of your screen.
- Un-transpose by repeating the action.

Averages/Totals Toggle
- Toggle between the display showing "Peer Averages" vs "Peer Totals" by double-clicking the designated area in the upper right of your document.

Add New Rows/Columns
- You can add new rows or columns adjacent to the populated table. The new columns or rows will take on the connected refreshable formatting.
Find a Charter Number / Institution ID
Option 1: Refer to the below Built-In Peer Group List
Utilizing the Built-In Peer Group List below is a quick and easy way to find the necessary Institution ID (-CDSID) for use in the Data Connector.
Peer Pointer!
Remember that all Institution IDs must be entered as a negative number when used with the Data Connector.
| Built-In Peer Group Name | Institution ID/(-CDSID) |
|---|---|
| All Credit Unions in U.S. | -240000 |
| Credit Unions over $10B | -240001 |
| Credit Unions $1B-$10B | -240030 |
| Credit Unions $500M-$1B | -240002 |
| Credit Unions $250M-$500M | -240003 |
| Credit Unions $100M-$250M | -240004 |
| Credit Unions $50M-$100M | -240005 |
| Credit Unions $20M-$50M | -240006 |
| Credit Unions $10M-$20M | -240007 |
| Credit Unions $5M-$10M | -240008 |
| Credit Unions $2M-$5M | -240009 |
| Credit Unions Less Than $2M | -240010 |
| All CUs That Ever Existed | -240028 |
| HMDA Reporting Credit Unions | -328723 |
| All Banks in U.S. | -240011 |
| Banks over $10B | -240012 |
| Banks $1B-$10B | -240013 |
| Banks $500M-$1B | -240014 |
| Banks $250M-$500M | -240015 |
| Banks $100M-$250M | -240016 |
| Banks $50M-$100M | -240017 |
| Banks $20M-$50M | -240018 |
| Banks $10M-$20M | -240019 |
| Banks $5M-$10M | -240020 |
| Banks $2M-$5M | -240021 |
| All Banks That Ever Existed | -244703 |
Option 2: Create Your Own Reference Table
If you're seeking to gather a list of Charter Numbers for specific institutions or need to find the Institution ID for a custom peer group, follow the instructions below to create your personalized reference table:
- Create a custom leader table:
- Add the following Smart Codes directly to the Table :
- Charter Number: (CharterNum)
- InstitutionID: (Intuitionid)
- Name and Save this Display.
Now, you'll have a personalized table that empowers you to filter and search for specific institutions or custom peer groups within your comparison set. This table allows you to retrieve Charter Numbers and Institution IDs, ensuring compatibility with the Data Connector.

Peer Suite's Data Connector is your key to efficient data management in Excel. It simplifies the process of exporting and customizing data, making your tasks easier and more productive.