How To Create A Custom Display
Creating custom displays in Peer Suite puts you in the driver’s seat, letting you tailor charts and tables that spotlight exactly the trends and comparisons your credit union cares about. Whether you want to monitor key performance indicators over time or drill into side-by-side comparisons, these tools adapt to your needs.
Quick Navigation:
Getting Started
To create a custom chart or table:
- Click Create from the top navigation.
- Choose either a Chart or Table template.

You can also use the quick access button in the left navigation to open a new display window.

Metric Inputs
On the display builder screen, you’ll see a blank display canvas and a formula table. Start typing in the search bar to see matching results from our database. Click any item to add it to your formula table. If you're using raw account codes, manually type those into the table.
You can use any combination of:
- Raw account codes
- Smart Codes
- Formula Macros
- Custom formulas

Input Options:
- Smart Codes: Smart Codes are easy to use, prebuilt shortcuts to call report codes and formulas, designed by Callahan analysts to streamline reporting. They auto-update to reduce the chance for error when code definitions change.
Want to include bank data? Use our Bank Smart Code Guide to reference metrics from the FFIEC Call Report.
- Account Codes: If a Smart Code doesn't exist for your metric:
- Enter the 5300 Call Report account code manually.
- Add an "A" prefix to the code so Peer Suite can recognize it.
- Example: the 5300 code 730a (Total Cash on Hand) becomes A730a
- The bank data in Peer Suite comes from the FFIEC Call Report. Learn more about bank data in this overview: Bank Data Overview.
- Formulas: You can combine account codes or Smart Codes with built-in functions and operators to build your own formulas.
- Functions: Functions are ways to simplify complex formulas. You can use these commands when you create custom displays in Peer Suite to modify account codes. (EX: Growth, Change, and Rank)
- Operators: Operators include mathematical symbols like +, -, /, *, ^, as well as specialized ones unique to Callahan (:). These operators serve as building blocks to craft formulas.
Learn more about using operators, additional functions, and about building formula in this guide: Operators and Functions Manual.
Formula Macros
Peer Suite's Macros are powerful tools designed to streamline your workflow by allowing you to input multiple complex formulas for related data sets simultaneously. This simplifies the process of building charts or tables, as well as increases the speed and efficiency of analysis.

Check out our guide to learn more about Formula Macros here.
Peer Pointer!
Use “CTRL + F” to quickly search these resources and find the metric you need:
Organizing Your Data
As you add metrics, this is what your Enter Formulas section may look like:

Peer Pointer!
Click into the title field beside the formula to rename for clarity in your display.

Reorder Your Metrics
- Drag and Drop: Rearrange rows manually. This method offers flexibility when managing smaller datasets.
- Insert and Delete: Click the + icon to add new lines where needed and the X icon to remove unwanted data. This method is helpful for handling large datasets.

Chart and Table Types
Once formulas are entered, choose how to visualize them using the below families of displays.

Peer Pointer!
As you add metrics to your display Peer Suite will automatically adjust to only show the chart or table types that work with your current data set.
- Trend includes options related to viewing your metrics over time. When you choose multiple items of different types, such as a ratio and a dollar value, dual-axis options will become available.
- Composition is available where the formulas you select are parts of a whole, such as new and used auto.
- Correlation can take up to three inputs, showing you the relationship between your choices.
- Tables include the option to display data by comparison set, time trend, or individual credit unions.
To find additional display types, click your desired icon and explore the option available from the dropdown.

Peer Pointer!
Even after your display is finalized you can continue to adjust the way you view it using the display view toggle in the the modification tool bar. Learn more in this guide.
Name & Save Your Display
1. Name your display:
- Click the Name field at the bottom of the screen and enter a unique title that reflects the purpose of your display.
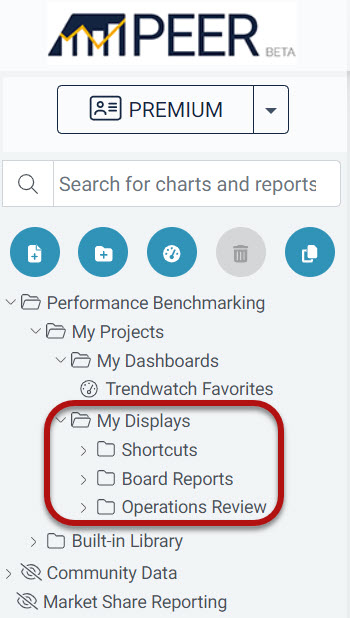
2. Choose where to save it (Save To):
- To the left of the name field, use the My Displays dropdown to select a save location. This dropdown lists all folders available in your left navigation panel.
- Subfolders are indicated with a dash (–) before their name.
- Choosing a save path now helps you stay organized and prevents extra sorting later.

3. Don’t want to choose a folder right now?
If you simply click Save, your new display will default to the My Displays section under My Projects.
From there, you can manually move it to a specific folder or dashboard at any time. Learn more about creating custom folders and dashboards in this guide.
Peer Pointer!
Want to preserve your original display and make edits to a new version?
Click Save As after making edits to create an altered duplicate, while keeping the original intact.

Add a Subtitle to a Custom Display
- Save your display first.
- Hover over the title at the top of the canvas.
- Click the + icon to add a subtitle inline.
- Use the edit icon to update the subtitle later.

Conclusion
With your new custom display in place, you can instantly visualize and share actionable insights across your team or board. Remember, features like Smart Codes and Formula Macros are there to speed up your workflow—and the organizational and subtitle features help keep your library tidy and easy to navigate. Ready to explore even more advanced options?
Check out our additional resources on dashboards and folder management to turn your displays into dynamic, shareable reports that drive smarter decision-making.
Continue learning here:
Peer Suite Formula Macros Guide