Peer Suite Formula Macros Guide
What Are Peer Suite's Macros?
Peer Suite's Macros are powerful tools designed to streamline your workflow by allowing you to input multiple complex formulas for related data sets simultaneously. This simplifies the process of building charts or tables, as well as increases the speed and efficiency of data analysis.

Formula Macro Quick Navigation Guide
How To Use Formula Macros
Accessing Macros:
-
Open the Custom Display Builder from the Create dropdown at top of your screen and choose your desired display type, chart or table.

Peer Pointer!
Need help building a display? Check out this guide to get started: How to Create a Custom Display
- Type the "@" symbol in the formula search bar to view all available built-in macros.

- Click on the macro of your choice to auto-populate it's associated fields directly into your custom display.
Peer Pointer!
Download this list to browse all of Peer Suite's Built in Formula Macros and to see their composition.
Editing Formulas:
After selecting a macro, multiple formulas will appear below your macro entry. You can edit, reorder, or delete these formulas as needed.

Customizable Macros
Some macros require adding a qualifier. A qualifier can be metric in the form of a Smart Code (or Custom Smart Code) 5300 account code, or a formula. The qualifier is necessary because the macro will use it as a basis to build its associated formulas. If a qualifier is not provided, an alert will prompt you to enter one.
To use Customizable Macros, input the macro along with the needed qualifier (your desired smart code, 5300 account code, or formula) within parentheses () directly in the formula field of your custom display table, as shown below.
Customizable Macros (Requiring Qualifiers)
| Customizable Macro | What to expect: | See it in action: |
|---|---|---|
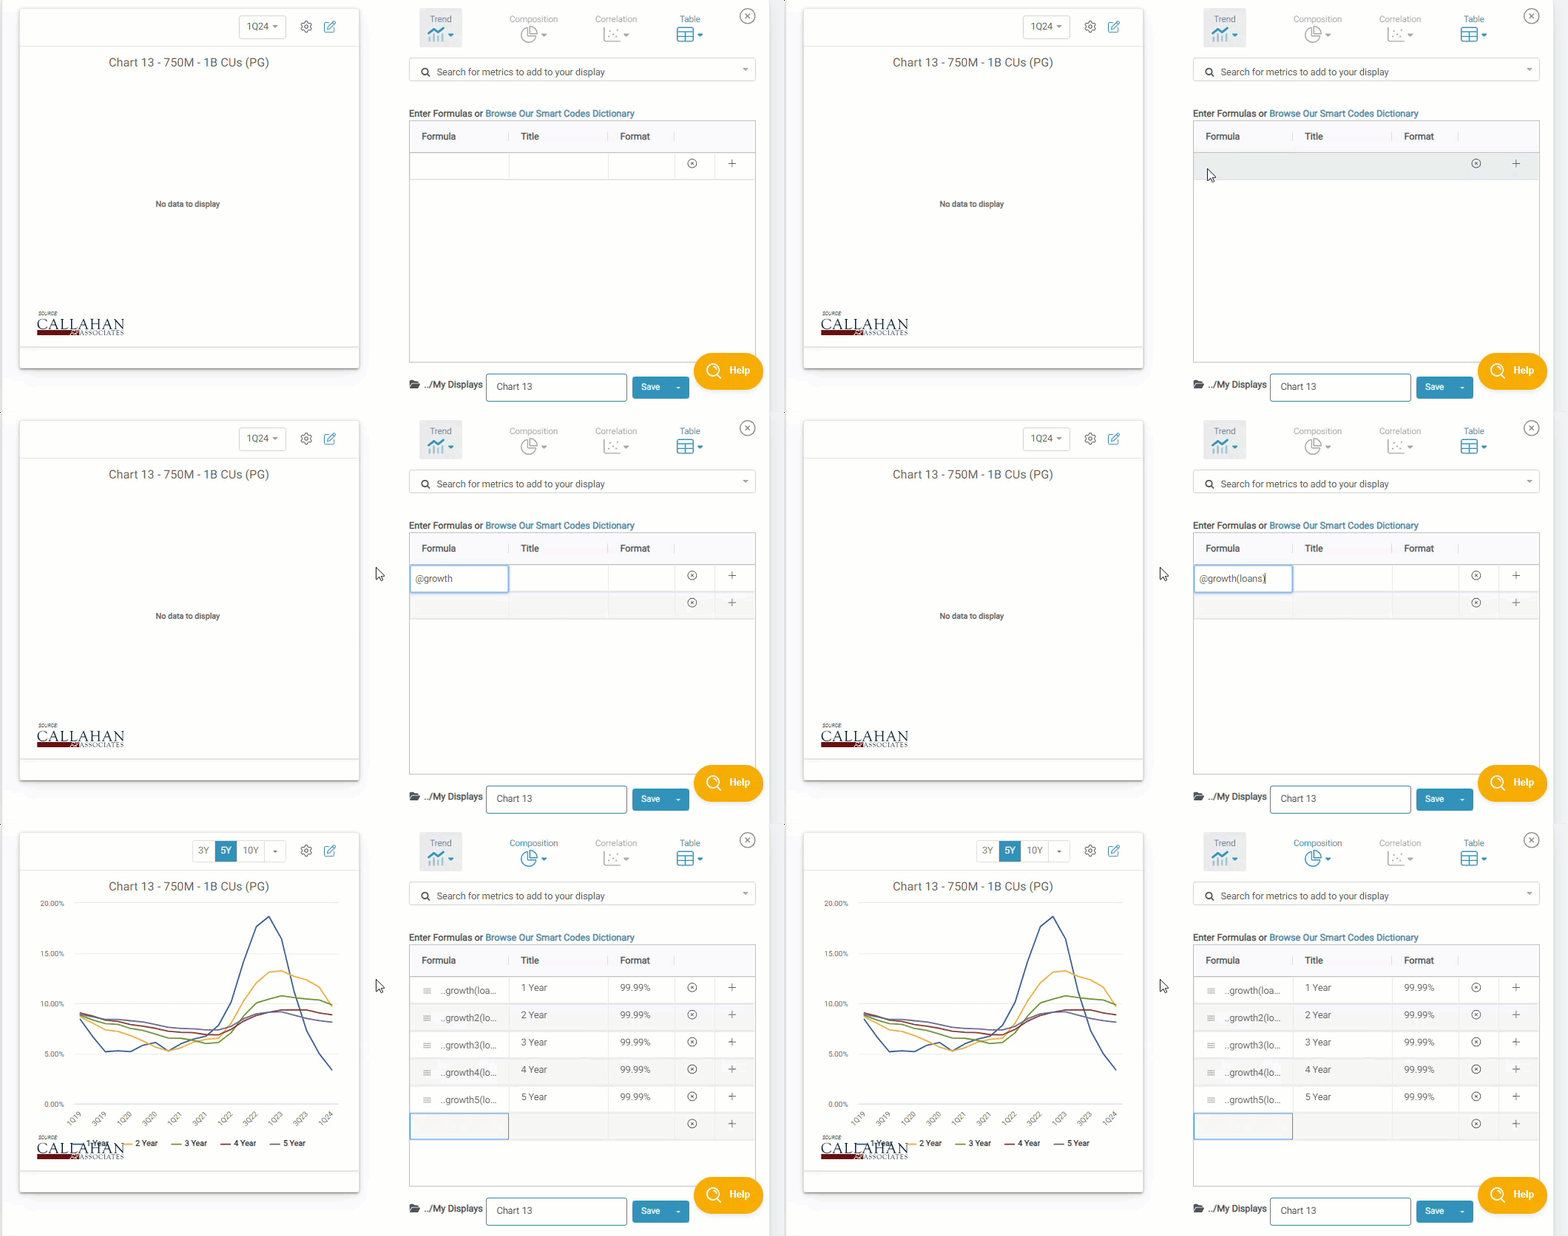
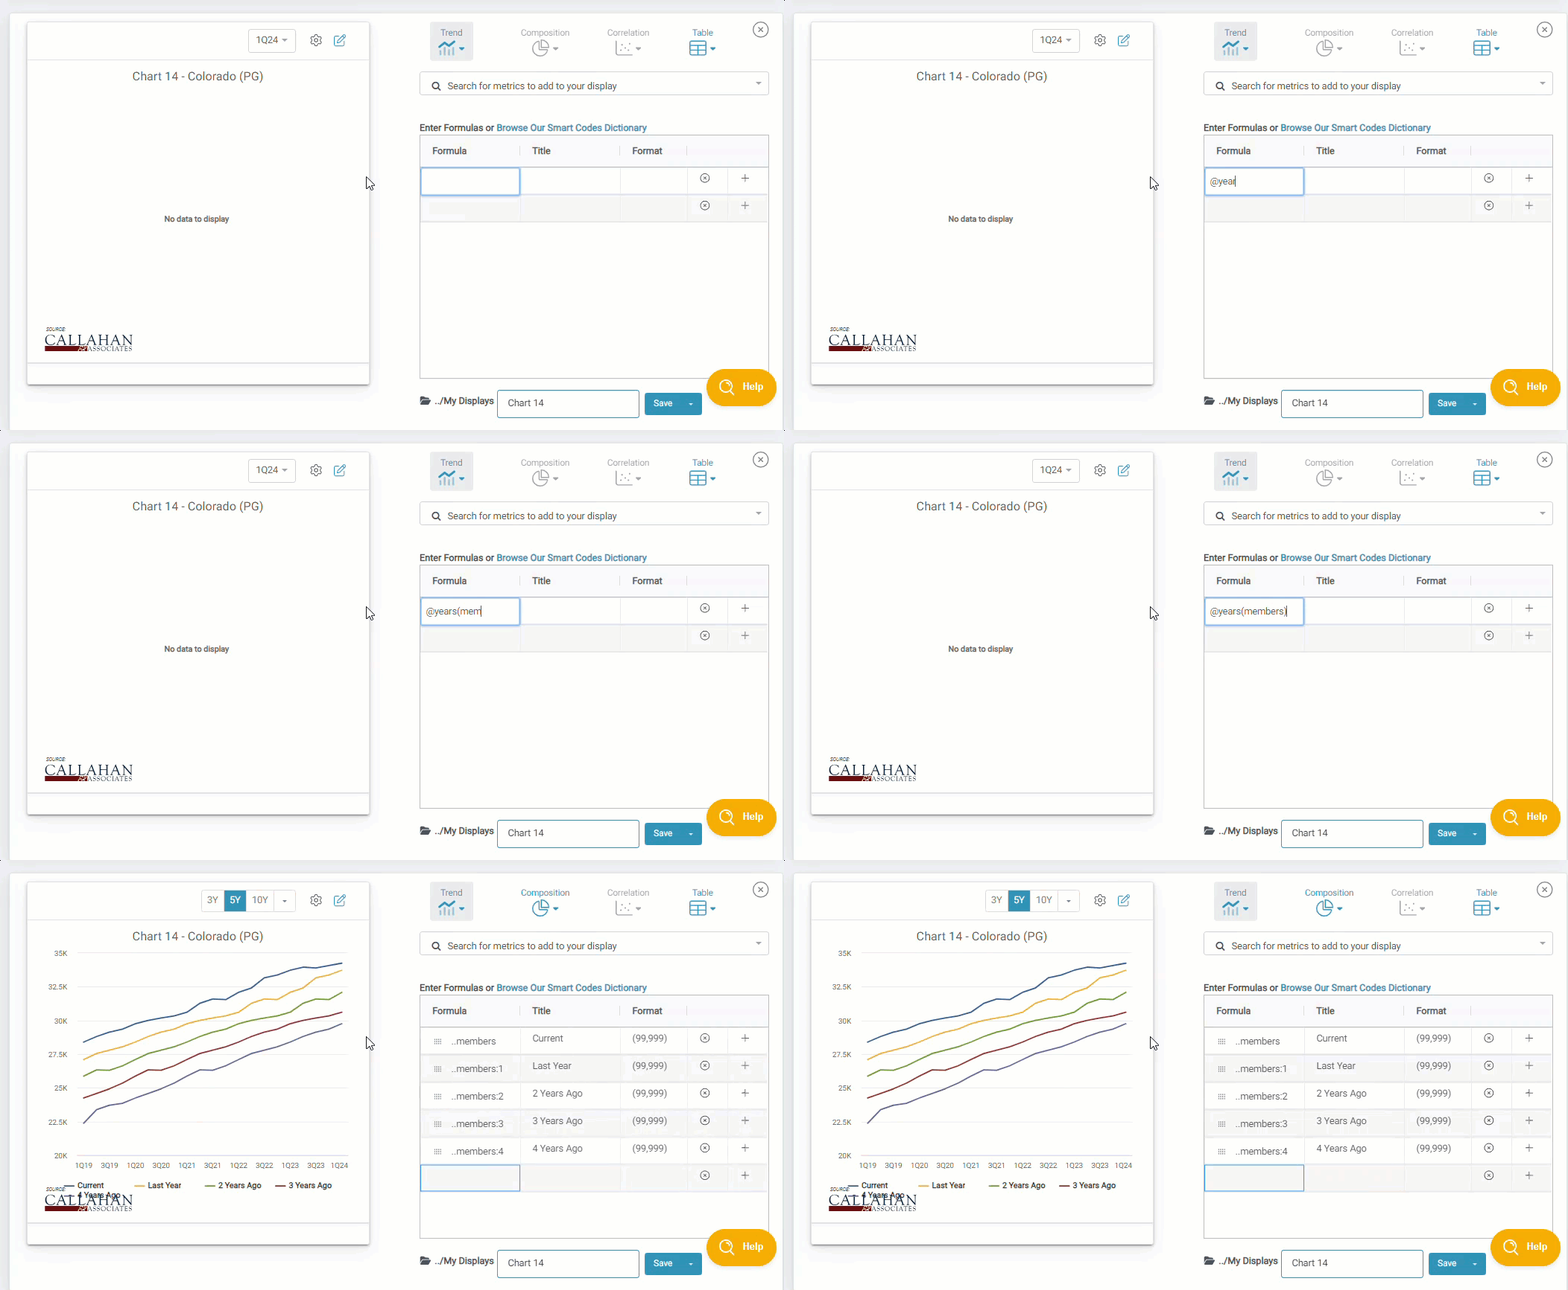
| @years() | This macro calculates the 12-month value for the prior 12 months for the selected qualifier. This macro will auto-populate 5 years of data. | |
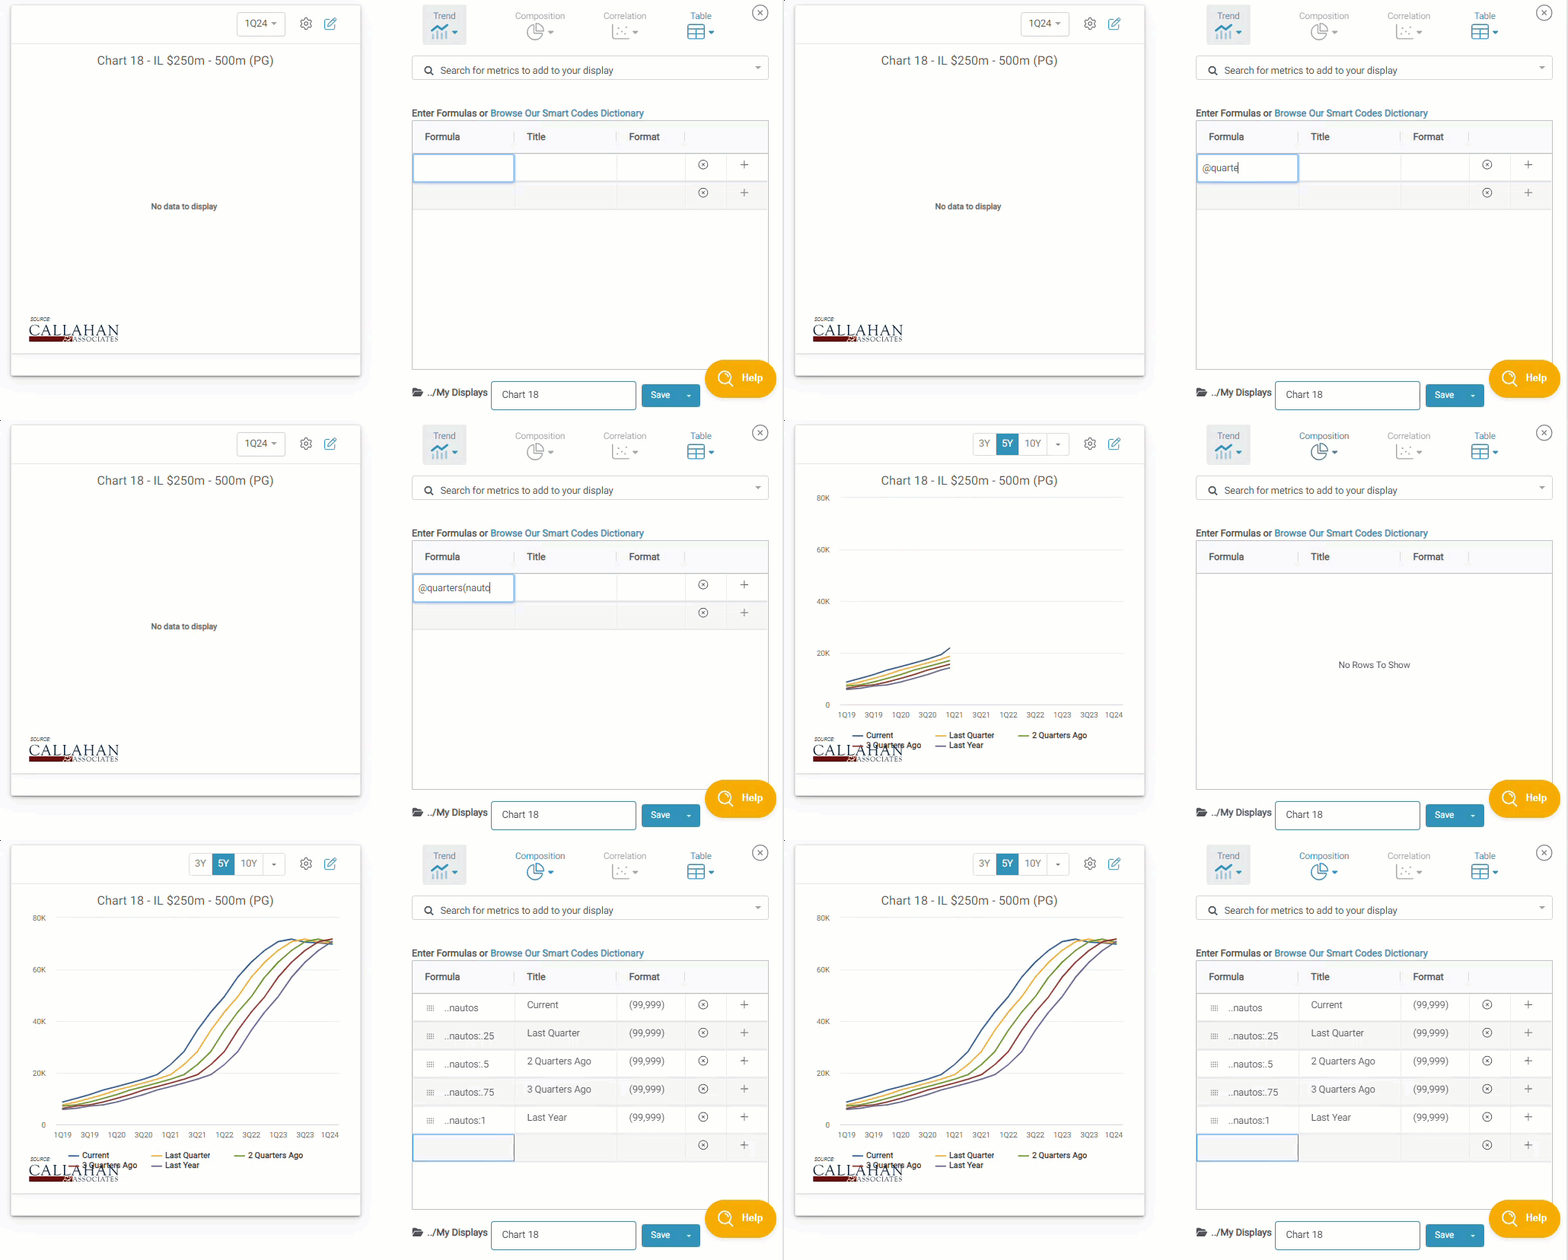
| @quarters() | Calculates the difference between this quarter and last quarter for balance sheet items or other continually accruing accounts. This macro automatically populates 5 quarters of data for your chosen qualifier. | |
| @growth() | The @growth macro calculates year-over-year or 12-month growth and is displayed as a percentage. This macro will auto-populate 5 years of data. | |
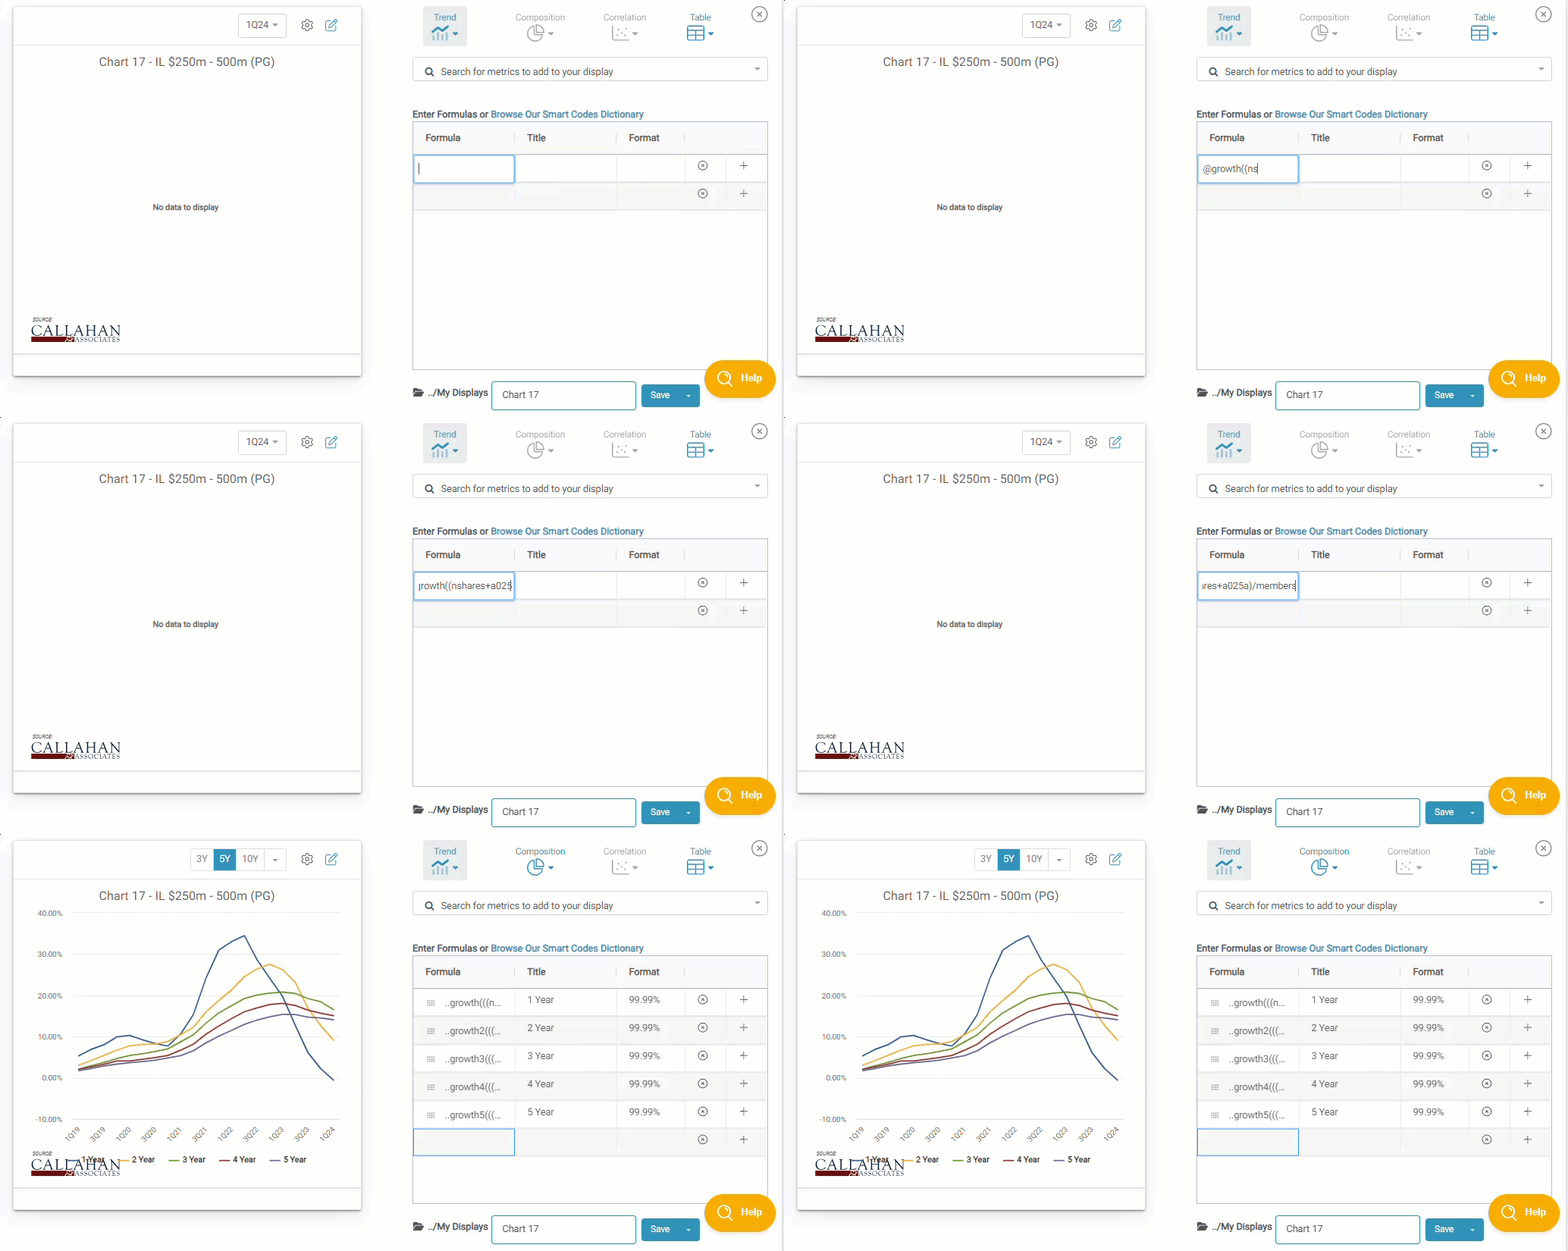
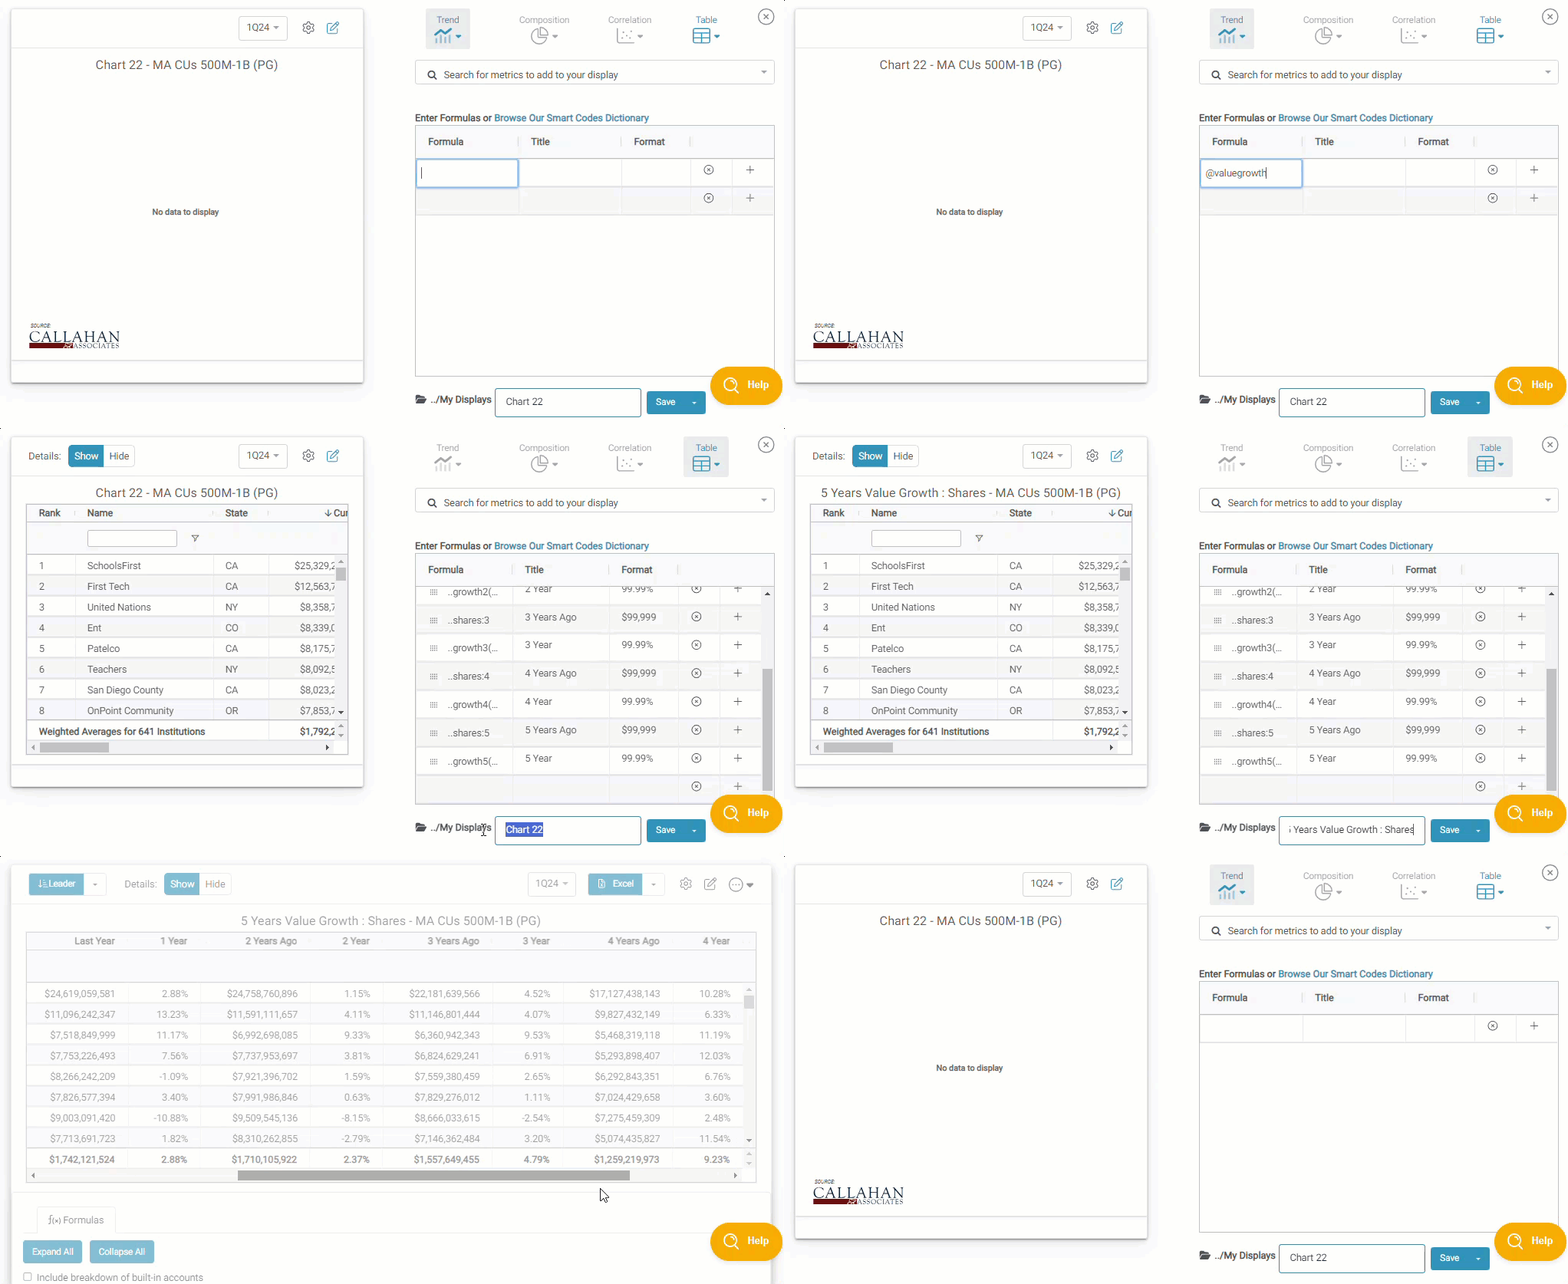
| @valuegrowth() | This macro displays the outputs for both the @growth and @years macros for your selected qualifier. This macro will auto-populate 5 years of data. | |
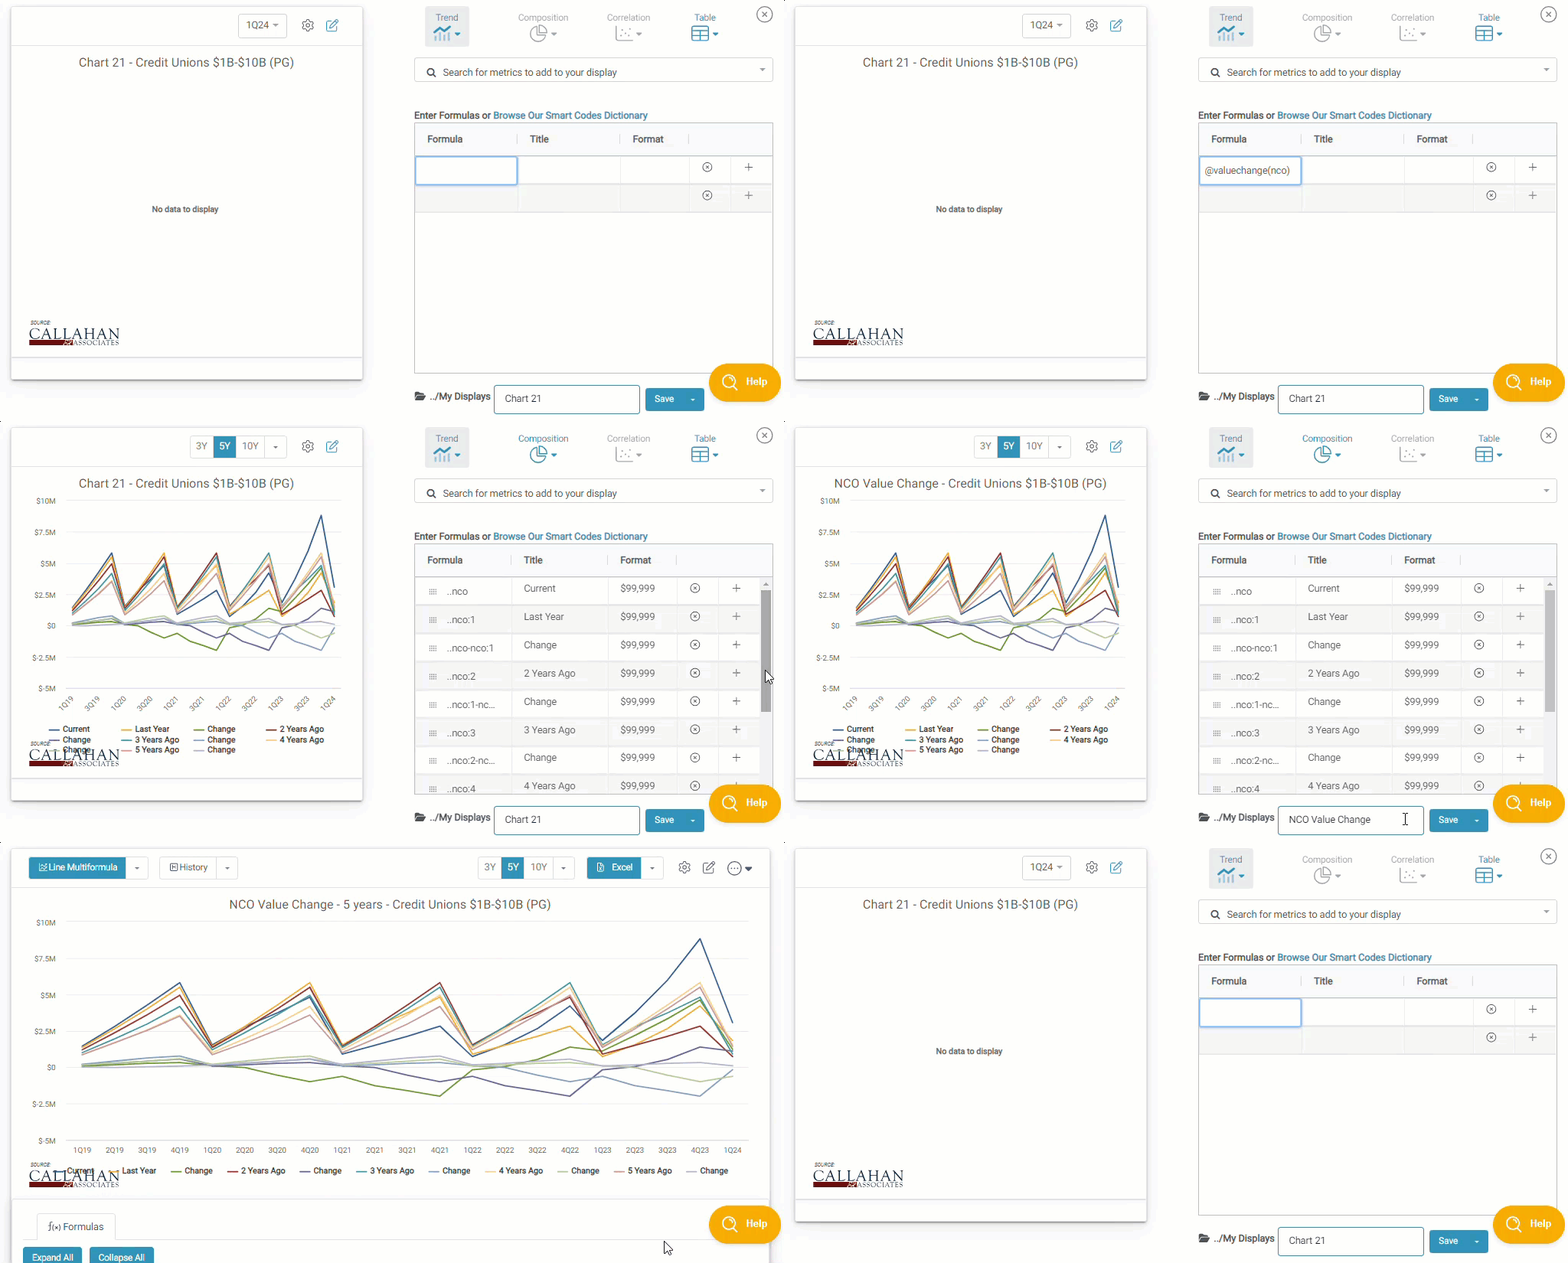
| @valuechange() | Calculates the difference between this year and last year for any continually accruing metric. The @valuechange macro essentially displays this calculation along side the @years macro output and will auto-populate 5 years of data. | |
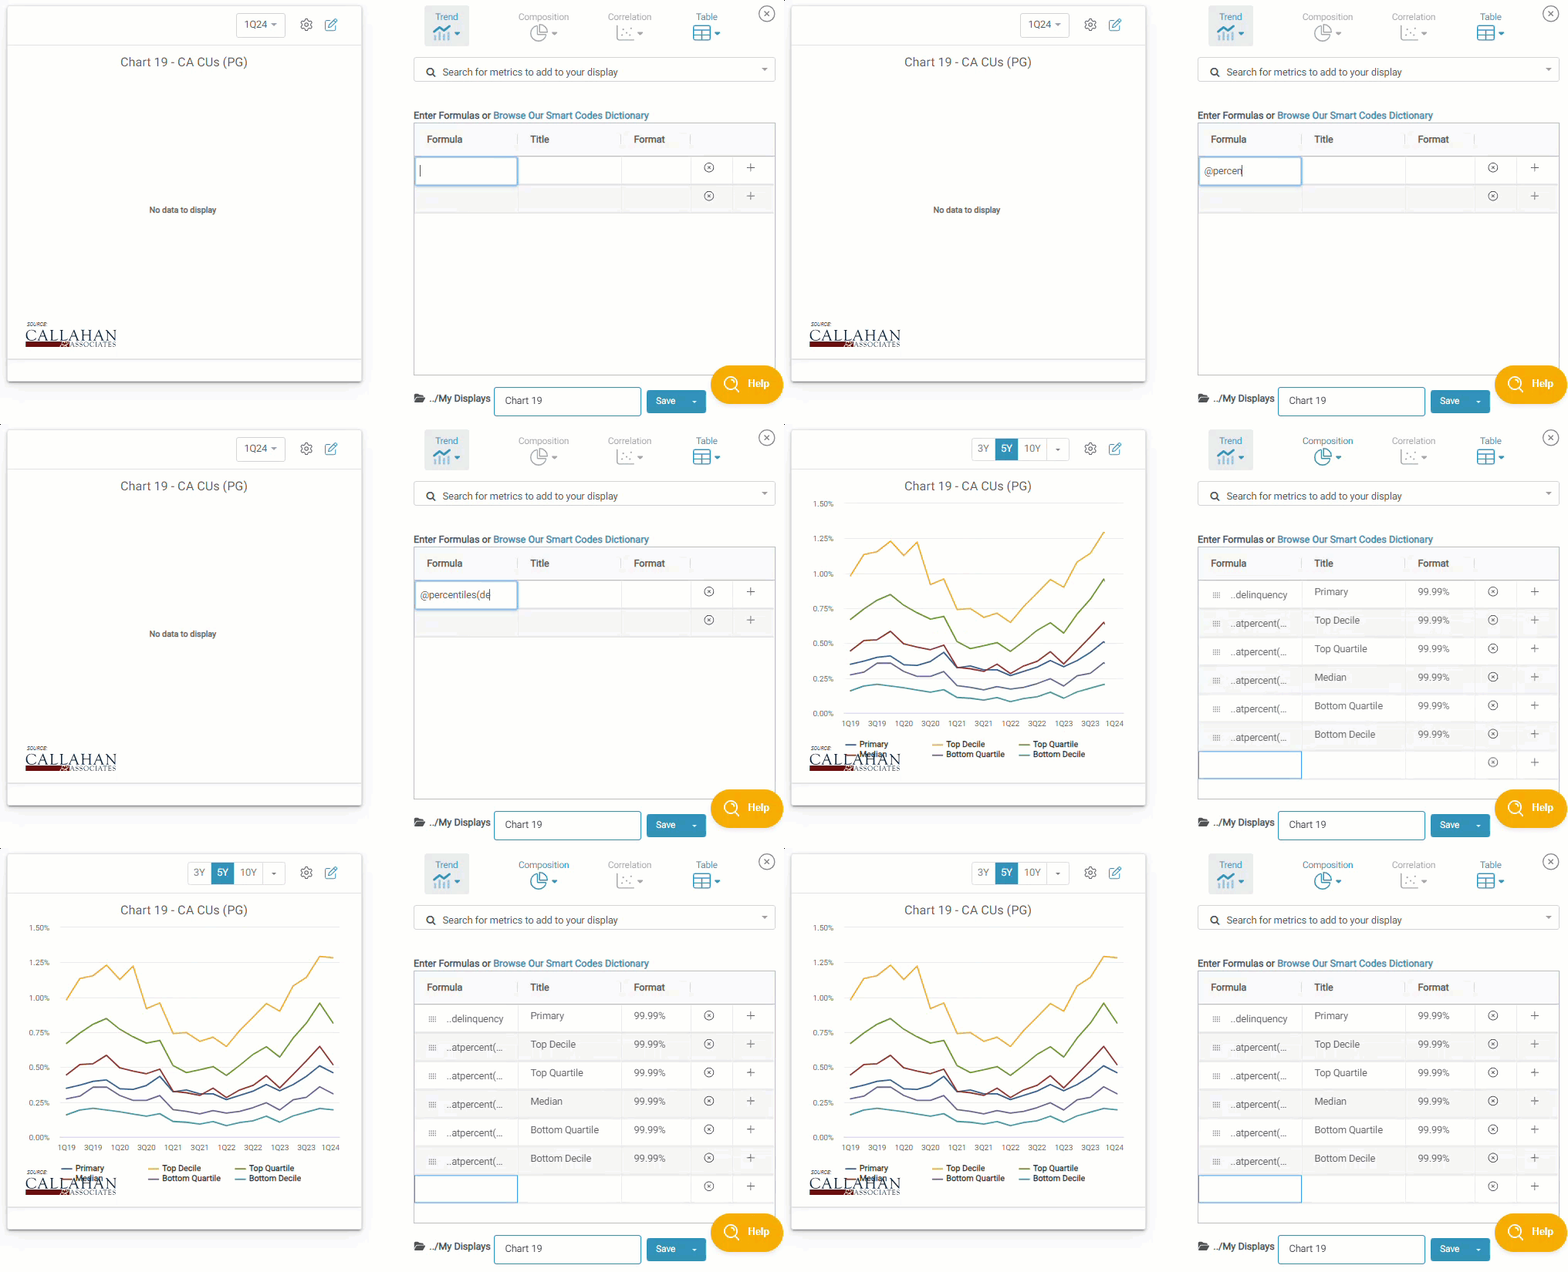
| @percentiles() |
This macro returns the value for a range of percentiles related to the peer groups within your comparison set for your chosen qualifier. Including:
|
|
| @accountinfo() | Provides analyses for your chosen qualifier metric, including current value, last year's value, growth, peer average, rank against peers, percentile, and industry growth. |
Conclusion
Peer Suite's Macros are designed to make your data analysis faster and easier. By automating the input of complex formulas, they save you time and effort. Customizing macros with specific qualifiers ensures you get precise and relevant outputs.
Want to learn more ways to enhance your custom displays? Consider registering for one of our upcoming Peer Suite Bootcamps.


