Market Overview Map Navigation
The Market Overview Map within the Market Share Reporting section of Peer Suite empowers you to analyze markets, visualize branch distributions, and identify potential mortgage and market opportunities.

Getting Started
The Market Overview Map is an interactive feature available exclusively at the Plus level of Peer Suite, found in the Market Share Reporting section via the left navigation.

Begin by Selecting a Comparison Set: This defines the data shown on the Market Overview Map as well as the reports within Market Share Reporting. Options include:
- Single institutions (credit unions or banks)
- Pre-built State and National Markets
- Custom markets created using branch footprints or specific geographic areas
Want to build a custom market? Learn how to create one here: How to Create a Custom Market
Map Navigation
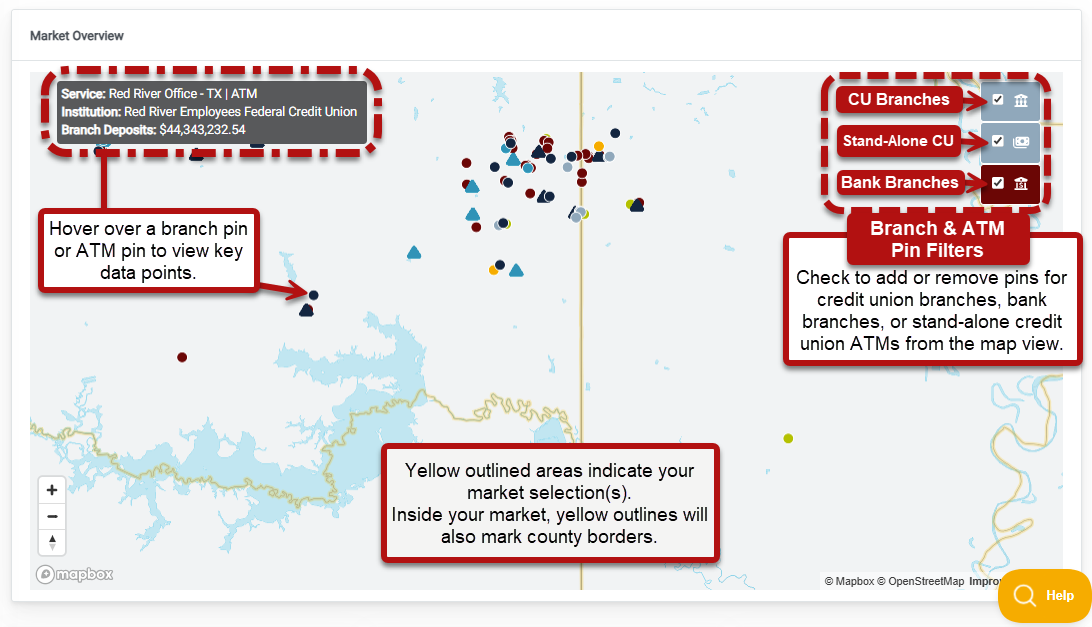
- Market Boundaries: Yellow outlined areas indicate your market selection(s). Inside your market, yellow outlines will also mark county borders. Adjust or add markets through your comparison set to focus on specific regions.

- Branch Pins: The map uses color-coded pins to represent different branch types
- Navy pins: Your primary's branches
- Light grey pins: Credit union branches
- Red pins: Bank branches
Peer Pointer!
The Market Overview Map allows you to spotlight up to three additional institutions using unique pin colors (teal, green, and gold). These highlighted institutions are also outlined in their respective colors within your comparison set. Other institutions continue to be color-coded by type (credit union=grey or bank=red).
Note: If a highlighted credit union operates standalone ATMs and you choose to display freestanding CU ATM pins, these will appear color-matched to their respective institutions.
- Triangle CU ATM Pins: Represent freestanding credit union ATMs, while in-branch ATMs will appear in the Branch Snapshot. ATM data is specific to credit unions.
- Branch Snapshot: Hover over a branch pin to see key data points about that branch.
Below the map, you will find summaries of your selected market(s), an overview, deposit dynamics, and mortgage originations (HMDA). Want a thorough breakdown? Check out this guide to the Market Overview Summary Statistics.


