Peer Express Quick Start Guide For League Affiliates
This guide covers the League-Affiliate Experience in Peer Suite and is intended for credit unions with league affiliation.
The Peer Suite resources described here are provided through a league affiliation and are designed for credit union professionals who need quick, reliable performance insight without the complexity of extensive customization.
The League Affiliate experience in Peer Suite Express makes it easy to understand how your credit union is performing and how it compares to your peers. With little setup required, you can spend less time navigating data and more time focusing on what it means.
With your league‑affiliate access to Peer Suite, you can:
- Quickly access key performance data without setup
- Rely on ready‑made reports and dashboards built around common leadership questions
- Track critical KPIs tied to financial and operational health
Together, these tools help you turn data into insight and support clear conversations with leadership and boards.
Quick Navigation
Prefer video training? Check out our "Getting Started in Peer Suite's Express level" on-demand webinar!
The Who of Your Analysis: Your Comparison Set
When you log in for the first time, Peer Suite automatically sets:
- Your credit union as the primary institution, shown in navy
- Your asset‑based peer group as the initial comparison
This gives you a ready‑to‑use starting point with no setup required.
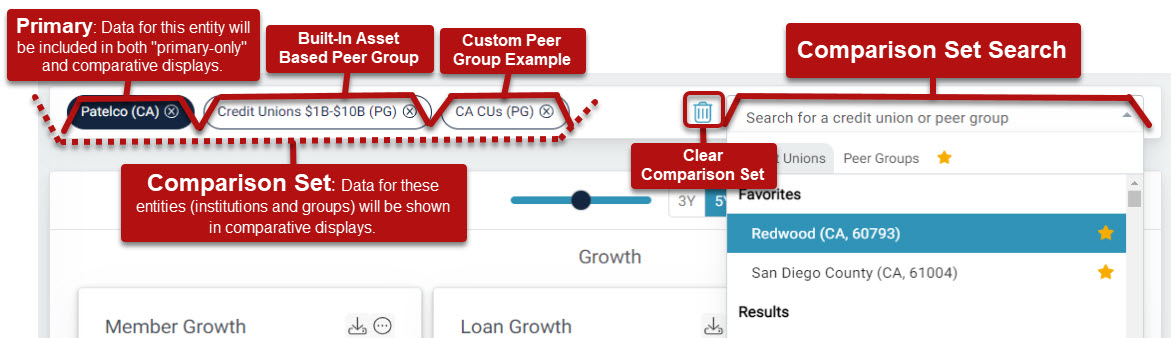
Primary: Your main point of reference. It appears in both primary‑only and comparative views and can be adjusted.
Comparison Set: The other credit unions and peer groups, built‑in or custom, you want to analyze alongside your primary.
See the image below to better understand your comparison set and navigate the comparison search.
You can:
- Add institutions using the Comparison Search
- Remove institutions by clicking the X next to an institution’s name
With a Peer Suite subscription, users can also analyze banks and model hypothetical mergers. League‑affiliate access focuses on core credit‑union benchmarking. Reach out to your Callahan Advisor to learn more.
Learn more in this guide: "The Who" of your Analysis: Your Comparison Set
Custom Peer Groups
Custom peer groups help you compare your credit union to institutions with similar characteristics, making benchmarks more relevant and actionable.
With league‑affiliate access, you can build peer groups using a curated set of criteria, including:
- State‑level geography
- A curated selection of performance metrics
- Charter type
- Core processor
- The ability to include or exclude specific institutions
How To Get Started:

- Open the Create dropdown in the top navigation
- Choose Select by Criteria
- Apply the mix of filters that align with your institution’s strategy.

Step‑by‑step guidance is available here: Creating a Criteria-Based Peer Group.
Some advanced peer‑group features are available with a Peer Suite subscription. If you have questions about expanding peer‑group capabilities, your Callahan Advisor can help.
The What of Your Analysis: Built-In Content

Profile Reports

Express Dashboards
The four Express Dashboard groups help credit unions understand:
|
|

Each dashboard display includes:
- Clear ratio definitions
- Callahan performance or AI‑powered analysis
- Star rankings for fast peer comparison
|
|
|


Learn more here: Unique Features of Peer Dashboards.
League Overview Map

Use the map to:
- See the full geographic footprint of credit unions within your league's market
- Identify areas of concentration, overlap, and lighter coverage in the population context
- Understand how individual institutions fit within the broader market
- Support high-level conversations about market presence, reach, and opportunity
For a full walkthrough, visit: League Overview Map Guide
Interested in advanced mapping features? Explore additional guides or reach out to your Callahan Advisor.
Display Modifications

Use the toolbar to:
- Adjust the trend length
- Add data labels
- Show or hide your primary institution’s name in the display title
- Reset displays to default settings
- Access additional display options
Peer Pointer!
During FirstLook, Callahan’s early data program, you will also use toolbar settings to view early data. FirstLook data is marked with an asterisk(*) in the dropdown menu.

Learn about these modifications and more in our Peer Suite's Toolbar & Display Modification Guide.
Download & Automate Your Findings
Download Your Findings

Peer Pointer!

Automating Reports

To schedule automated delivery:
- Select Email from the More Options menu
- Choose to send immediately or schedule a recurring delivery
- Recurring reports will be sent quarterly after official NCUA data releases
Step‑by‑step instructions are available here: How to Send and Schedule Automated Reports.
Conclusion
You’re ready to get started!
Check your comparison set, open a Profile Report, and explore an Express Dashboard tied to today’s priorities. From there, download or schedule insights to support ongoing conversations with leadership.
Ready to keep the momentum going? Check out these additional resources: